Some of the functionality of the DUECA/DUSIME software is provided by default modules. These modules are normally started on the number 0 node, in the dueca.mod script.
DuecaView
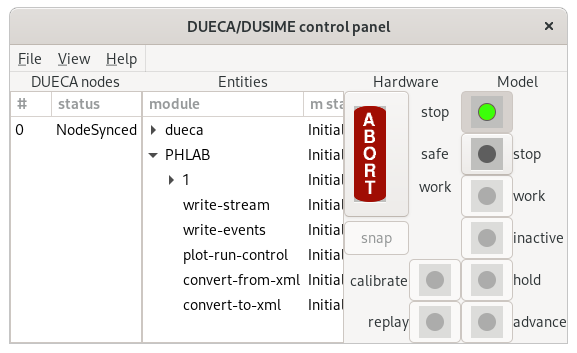
The DuecaView module is responsible for getting a window with control buttons and generic feedback up. This might be a small window for embedded type applications, or the familiar window usually seen in DUECA simulations. The DuecaView window can be configured with a glade file that has the window layout, or it can use the default glade file.
dueca.Module('dueca-view', <part name; string>, <PrioritySpec>).param(
    glade_file = <string>,
    # Supply the filename for the glade interface definition. If not
    # supplied, it uses a default window
    shutdown_script = <string>,
    # Script called to shut down the DUECA nodes
    position_size = <array of integers>,
    # Specify the position, and optionally also the size of the interface
    # window.
    )
'''Description:
Creates a main window for control of DUECA/DUSIME'''
A screenshot of the duecaview window is given below.
Dusime
The Dusime module is responsible for maintaining information on the DUSIME state of different modules. This module closely interfaces with the DuecaView module for the user interface; it connects to buttons on the interface initially opened by DuecaView, and supplies the status information for feedback on the module states. In case there is not DuecaView window, the DUSIME module will still function, but not offer buttons on the interface. You need the Dusime module if you want to run any DUSIME modules.
dueca.Module('dusime', <part name; string>, <PrioritySpec>).param(
    min_interval = <integer>,
    # minimum interval for simulation state changes.
    use_gui = <boolean>,
    # Use and access the common gui (default=true)
    block_advance = <boolean>,
    # Prevent programmatic transition to advance mode (default = #t)
    )
'''Description:
Optionally latches on to the DUECA interface, and operates the DUSIME
end of this interface. Otherwise still maintain tabs on DUSIME state'''
Activity View
The ActivityView module is one of a series of (currently three) modules that are optional and provide feedback on the performance of the DUECA system/simulation. The ActivityView module can sample the running of activities in the DUECA nodes, and create a graphical overview of these. This is especially useful in debugging new simulations with timing issues. When available, the ActivityView module installs a menu item in the view menu of the DuecaView.
dueca.Module('activity-view', <part name; string>, <PrioritySpec>).param(
    set_lookahead = <double>,
    # advance time needed for request sending
    position_size = <array of integers>,
    # Specify the position, and optionally also the size of the interface
    # window.
    )
'''Description:
Visualises activity data for the different DUECA nodes. When included,
this module adds a menu entry to a suitable dueca-view
'''
The upper part of the activity view shows timelines of activities, with one graph per node. After selecting a section of one of the time lines, details on the activities in that period appear in the list in the lower window.

Timing View
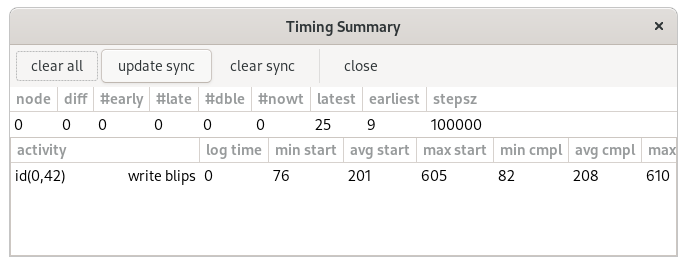
Another useful view is provided by the TimingView window. The TimingView module records summary information on selected activities. With the 'check-timing parameter, modules can be instrumented to provide timing information. The top part of the TimingView window supplies information on the synchronization performance of the DUECA nodes, the bottom part provides the summary information on the timing of activities. Timing information is also written to the file dueca.timinglog.
dueca.Module('timing-view', <part name; string>, <PrioritySpec>    )
'''Description:
Visualises timing data for the synchronisation between different
DUECA nodes, and timing results for activities, i.e. the TimingCheck
results. When created, the TimingView inserts an item in the DUECA
main interface'''
Log View
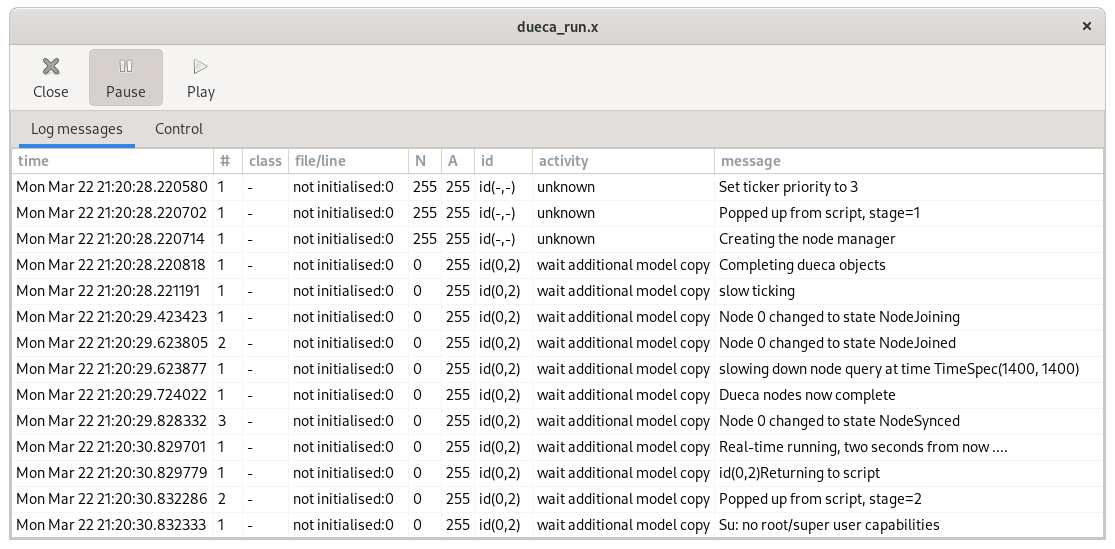
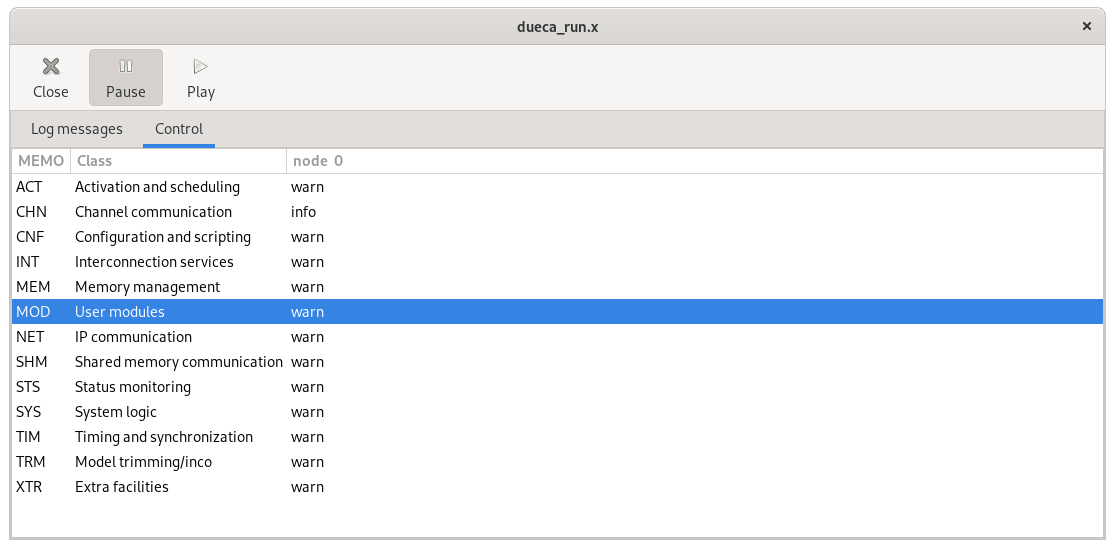
The LogView module assembles log messages from all DUECA nodes. It also offers the possibility to adjust the detail of logging during runtime.
dueca.Module('log-view', <part name; string>, <PrioritySpec>).param(
    numlines = <integer>,
    # Number of lines in log window
    )
'''Description:
Assemble log reports from all dueca nodes and present these in a
window generated with the current gui'''
The window has two panes. The first pane shows the resulting log messages, the second pane shows a set of controls, with which the log levels for different log classes are set.
Channel View
The ChannelView module enables inspection of the channels in DUECA. A list of channels is presented, with information on which entries each channel has, which modules write these entries, where these entries are read. To reduce the load on the DUECA communication system, information beyond channel structure must be requested actively. A refresh button assembles a write and read count for all channels, to give information on data use and production.
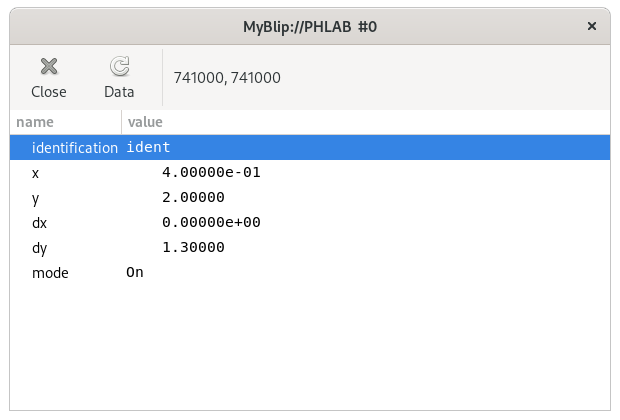
Each written entry can be inspected in a separate window, and a refresh will trigger the collection of current data in the entry, and presentation of that data in the window.
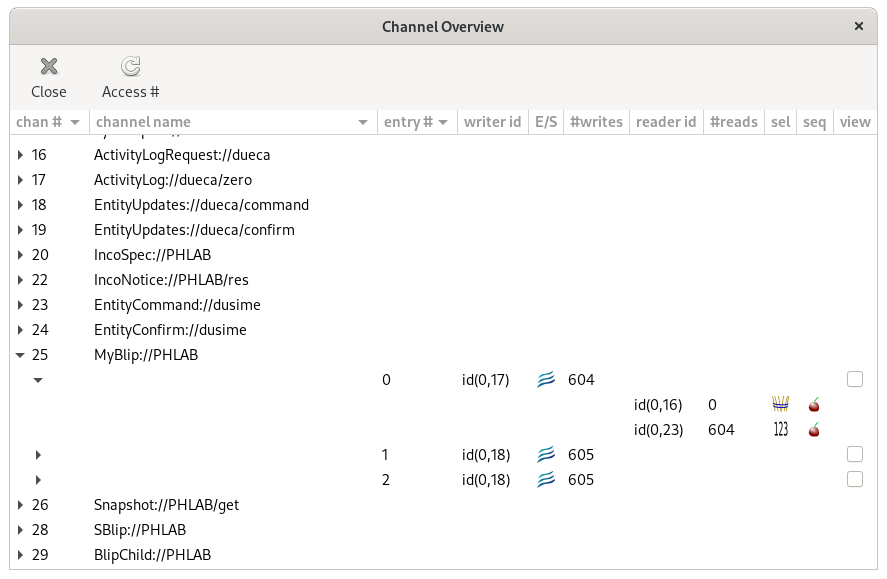
Here are some clues to the symbology in the channel view:
- The blue waves stand for stream data, continuous.
- The little markers for events, punctual.
- Cherries are for time-based reading the data, cherry-picking.
- The little pacman for gobbling up all data, sequentially.
- The bundle of wheat stands for collecting and reading all (type-matching) entries in a channel.
- The numbers for selecting an entry on the basis of its order.
- ABC for selecting an entry on the basis of the entry label.
The reader and writer id's carry pop-up data, to be seen by hovering the mouse over them.